While you’re here, you may wish to attend one of our upcoming workshops:
Workplace Investigation Fundamentals
If a complaint of workplace harassment is made, do you know how to respond, investigate, and report on it — legally and correctly? If you don’t, you are not alone. This 3-day course is a crucial primer for today’s climate. Investigate mock complaints (inspired by our work across the country) from start to finish, build your investigation skills, and learn how to avoid costly pitfalls.
A lot of work goes into producing an investigation report that is well-written and well-reasoned. But the finished product is more than just a set of words—it is also a visual experience for the reader. While visual elements such as white space and word font certainly enhance readability, in this blog post I focus on the communicative power of visual aids (images, tables, charts, etc.) and provide some best practices for including them in investigation reports.
The benefits of visual aids to improve comprehension and retention of information are well-established. Studies have shown that human cognition is divided into two processing systems—visual and verbal—and that when text is combined with visuals, a person can use both processing systems at the same time, making complex ideas more manageable and facilitating their ability to encode and recall new information.1
When it comes to investigation reports, visual aids can help organize and display information in a way that maximizes clarity, draws attention to key points, summarizes complex ideas, and makes findings more transparent and readable.
Types of visual aids
Here are some examples of visual aids to consider using in your next investigation report:
Maps/floor plans: The subject of many workplace investigations involves incidents that occurred in-person between two or more individuals. If the location or relative positions of the parties involved is in dispute, use a map or floor plan obtained from the employer to elicit evidence from the parties/witnesses during interviews and to demonstrate in the report how important events are alleged to have unfolded spatially.
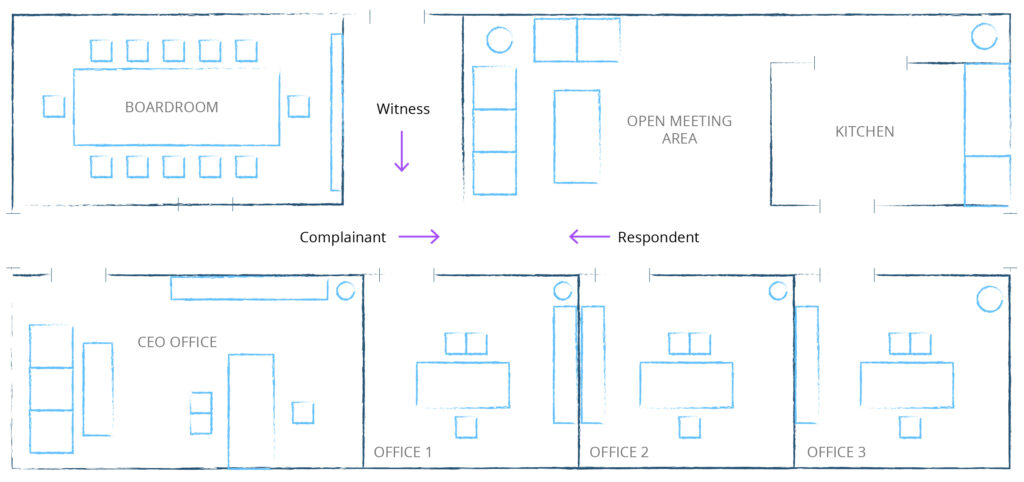
Fig. 1: Sample of an office floor plan, used to demonstrate how important events unfolded spatially.
Photographs/images: Presenting evidence using a picture or image will sometimes be necessary in an investigation report, depending on how central it is to the allegations. Even when not necessary, consider how the use of an image on a key issue might make information more memorable and digestible than a written description alone. Examples include screenshots of digital evidence, such as interactions over social media. Where a party is relying on a handwritten document, consider whether embedding a photo of it in the report, as opposed to transcribing it and attaching it as an appendix, might enable the reader to absorb its contents more easily.

Fig. 2: Fictional Facebook comment thread, relied on by the complainant (Jaz) in her sexual harassment complaint against her former coworker, Brent.
Timelines: When the content of an investigation report is complex and lengthy, the reader needs to grasp both the big picture and the details and be able to switch between these two views. For investigations that involve a larger number of allegations over a long period of time, timelines give the reader a unique view of how events are alleged to have unfolded. Where the dates of events are not in dispute, consider including a timeline in an overview section. Timelines can be made simply using a bullet point list—a great way to visually organize information—or by using one of many timeline-making tools available online.
Legends: It can be confusing for the reader to keep track of who is who in an investigation report that references many key players. Similarly, the meaning of acronyms or technical terms can be easy to forget in reports involving industry-specific language. A legend is a great way to visually catalogue and summarize this kind of information, serving as a quick reference point.
Tables and charts: Flow charts are excellent for illustrating complex processes, such as workflow, or interrelationships, such as the organizational structure of a company. Displaying this type of information visually can help make it clear to the reader in a way that writing alone cannot. Tables are a useful tool for juxtaposing evidence or other information that you can compare for effect. Tables can also be used to sort large amounts of information into categories, such as allegations of different types of misconduct.
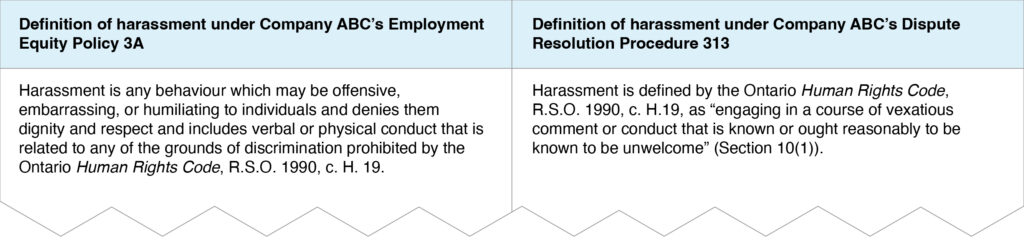
Fig. 3: Example of a chart, used to compare two different definitions of harassment under Company ABC’s policies.
Best practices
A visual aid is not a decoration. It must add value by enhancing the clarity and understandability of the findings and analysis in your report, and its presentation should convey a sense of credibility.
If not presented carefully, visuals can confuse the reader or draw the mind away from the nuances of the investigator’s factual findings or analysis. Images in particular should be used with great care to avoid inadvertently misleading the reader. Studies have shown that we process images differently than we do text—namely more quickly, with more emotion and bias, and with a heightened confidence in our own understanding of the image.2
Consider the following best practices when including visuals in your report:
Introduce and explain it: Describe each visual in the body of your text before presenting or displaying it. Be thorough, letting the reader skip the visual if they like. Identify who created it, what it represents, and its relevance to the issues at hand. Labels should be used on maps or diagrams that are intended to showcase important information. If you have manipulated an image that has been provided to you, for example by changing the focus or composition, it is important to state this.
Aim for quality, not quantity: Be selective in choosing what visuals you will embed in the body of your report. Is an image fuzzy? Is a visual overly complicated? Complex or low-quality visuals can be harder to decipher than writing, and the unrestrained use of visuals throughout a report can be an unnecessary distraction. If the visual fails to add communicative value, do not use it. If you must include it, consider attaching it as an appendix instead of embedding it in your report.
Ensure accessibility: An important consideration when incorporating visuals into your report is accessibility. If using colour, be familiar with best practices on designing colourblind-friendly visuals.3 Avoid using tiny arrows or text in your labels, which can be challenging for those with other vision impairments. If using a table, keep it simple and follow accessibility guidelines so it can be easily navigated by screen-reading tools for users who are blind or partially sighted.4 Images should be accompanied by alt text—a short text description—which can be read aloud by a screen reading tool.5
It is important to be careful and thoughtful about what visuals you choose to include in your report, and how you present them. In doing so, you can avoid the pitfalls and reap the benefits of using visual aids, namely by enhancing the overall readability and clarity of your findings and analysis.
Please note: All images and scenarios used as examples in this blog have been created by Rubin Thomlinson LLP and are fictional. Use of these images without permission is prohibited.
1 Paivio, A., “Mental imagery in associative learning and memory,” (1969) 76:3 Psychological Review 241-263; Paivio, A., Imagery and verbal processes, (New York: Holt, Rinehart and Winston, 1971); Clark, J. M., & Paivio, A, “Dual coding theory and education,” 3:3 Educational Psychology 149-210.
2 Ann Marie Seward Barry, Visual Intelligence: Perception, Image, and Manipulation in Visual Communication, (State University of New York Press, 1997), 3–6.
3 See, for example, WebAIM: “Visual Disabilities – Color-blindness.”
4 Diane Brauner, “Creating an Accessible Table in Word,” Paths to Technology, March 3, 2017, Perkins School for the Blind.
5 “Write good Alt Text to describe images,” Digital Accessibility, Harvard University.
Our Services
Our services recognize the human side and the legal side — equipping organizations with the insight they need to become healthier and more resilient.
Learn more about our services here.